Interactive Metrics Comparison with 3 Topics and Progress Bars
ByDescription
This dynamic visual breaks down three different themes, each with their own strengths and weaknesses, displayed through animated bar graphs. Ideal for showcasing performance metrics, survey results, or feature comparisons in tech product demos, business insights, or educational content. The clean interactive style and color-coded bars make complex comparisons instantly clear.
Details
5s
1920x1080
6 texts
2 images
Similar Animations

Interactive Metrics Comparison with 3 Topics and Progress Bars

Progress Bar Comparison Animation | 4 Paths, Same Outcome

Progress Bar Comparison Animation | 4 Paths, Same Outcome

Modern Racing Bars Comparison Animation

Three-Video | Video View Count Comparison with Bold Highlights

Sleek Slider Animation Highlighting Three Key Aspects
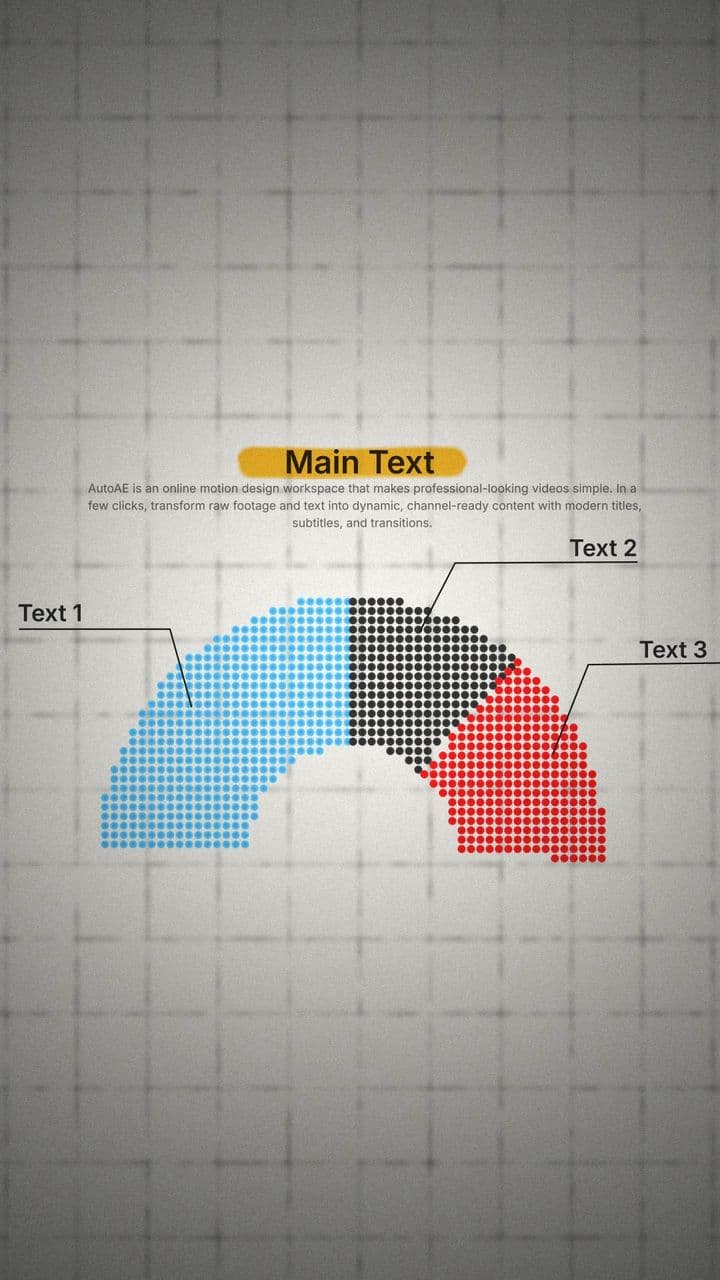
Dot Matrix Semi-Circle Animation (3 Segments) | Abstract Comparative Graphic

3 Circular Progress Animations | Percentage Loading Rings
More Hooks By Davinci

4-Image Reveal with Character Twist
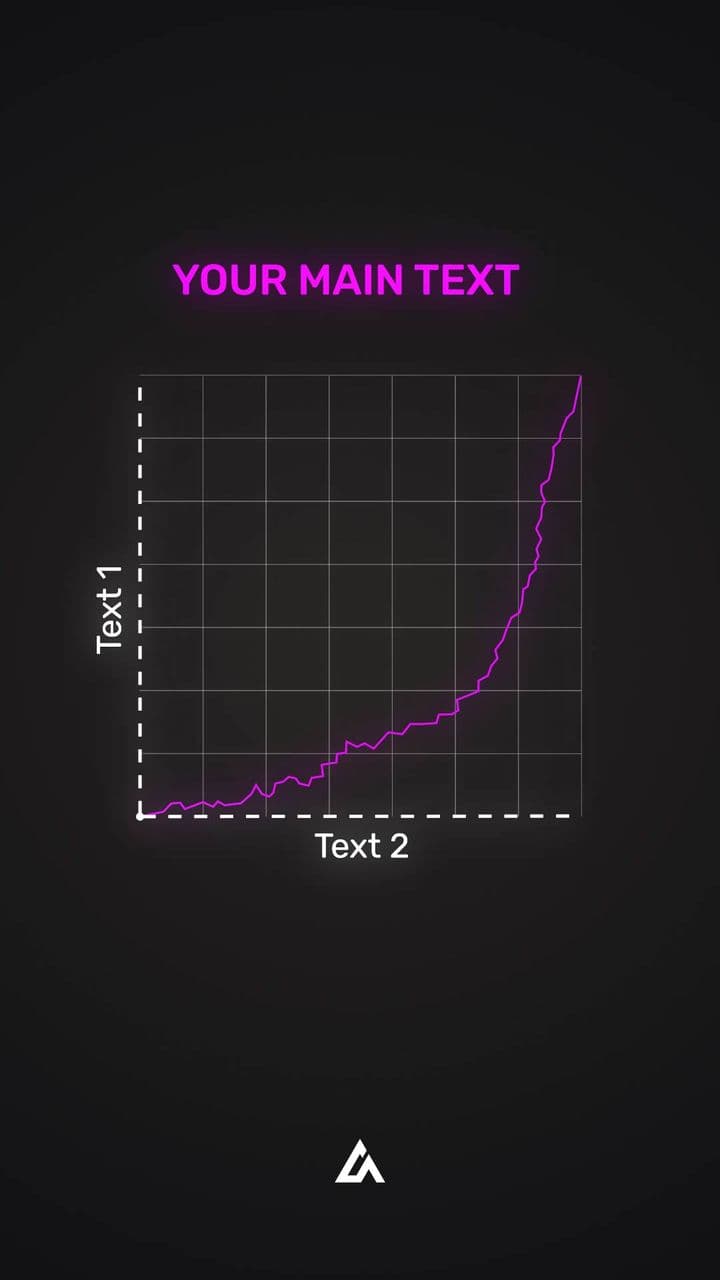
Explosive Growth Animation | Dynamic Line Chart Mockup
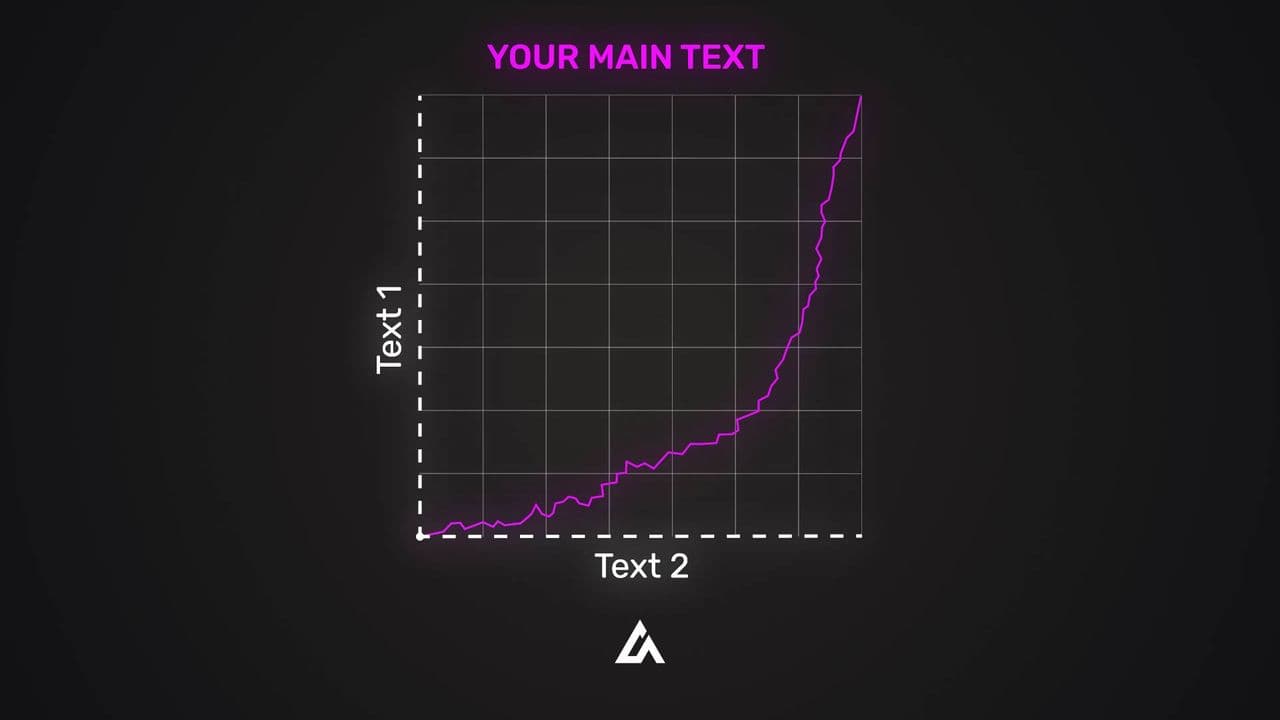
Explosive Growth Animation | Dynamic Line Chart Mockup

Animated Pie Chart Comparison – Highlight 2 Perspectives with Contrast

Animated Pie Chart Comparison – Highlight 2 Perspectives with Contrast

Animated Circular Flowchart | 4-Step Loop with Main Idea Highlight

4-Step Progress Animation | Bouncing Ball Reaches the Goal

Animated Circular Flowchart | 4-Step Loop with Main Idea Highlight
More UI Animation Templates
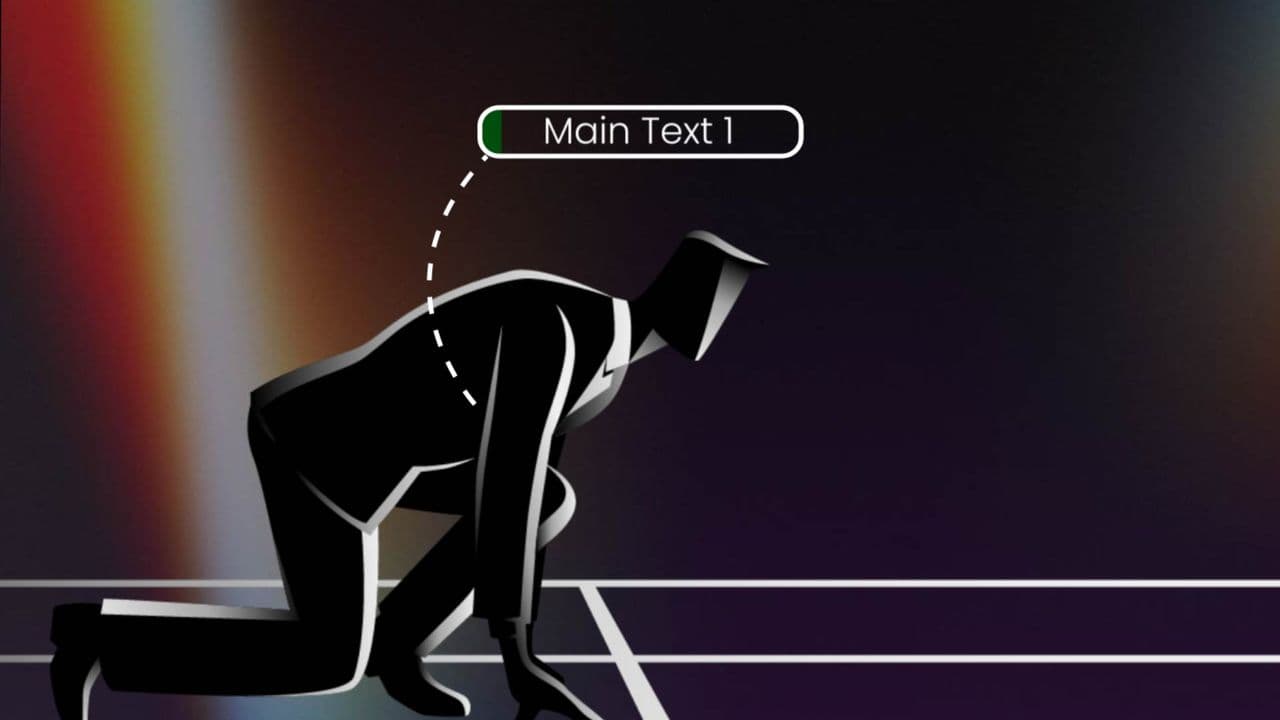
3 Text Business Start & Brain Concept Animation

5-Card Spread Animation | Vintage Tarot-Style Reveal for 3 Key Concepts

5-Card Spread Animation | Vintage Tarot-Style Reveal for 3 Key Concepts

Vintage Card Flip Animation | Single Text Reveal for Dramatic Highlight

Vintage Card Flip Animation | Single Text Reveal for Dramatic Highlight
10-Point Map Causal Relationship Animation
10-Point Map Causal Relationship Animation
