12-Point Monthly Data Animation
ByDescription
Perfect for showcasing year-over-year performance, marketing growth, or financial trends. This animated line graph highlights 12 key data points from January to December, each paired with customizable text for spotlight emphasis. Ideal for YouTube videos involving dynamic chart animation, business storytelling, or visual data summaries. Use it as a Numeric Highlight or Causal Comparison segment in your video, especially for topics like revenue growth, audience metrics, or monthly KPIs. Best suited for data-driven intros, section transitions, or business recap visuals.
Details
10s
1920x1080
12 texts
1 image
Similar Animations
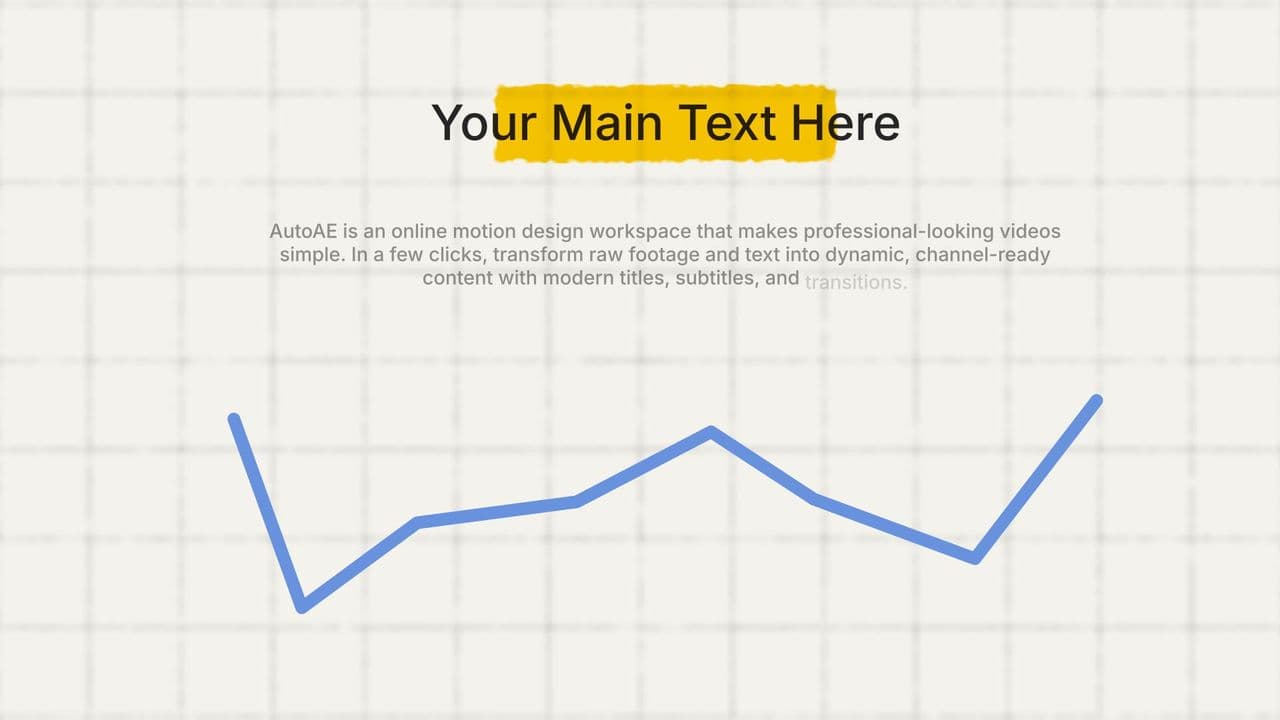
Dynamic Line Graph Animation with Highlight
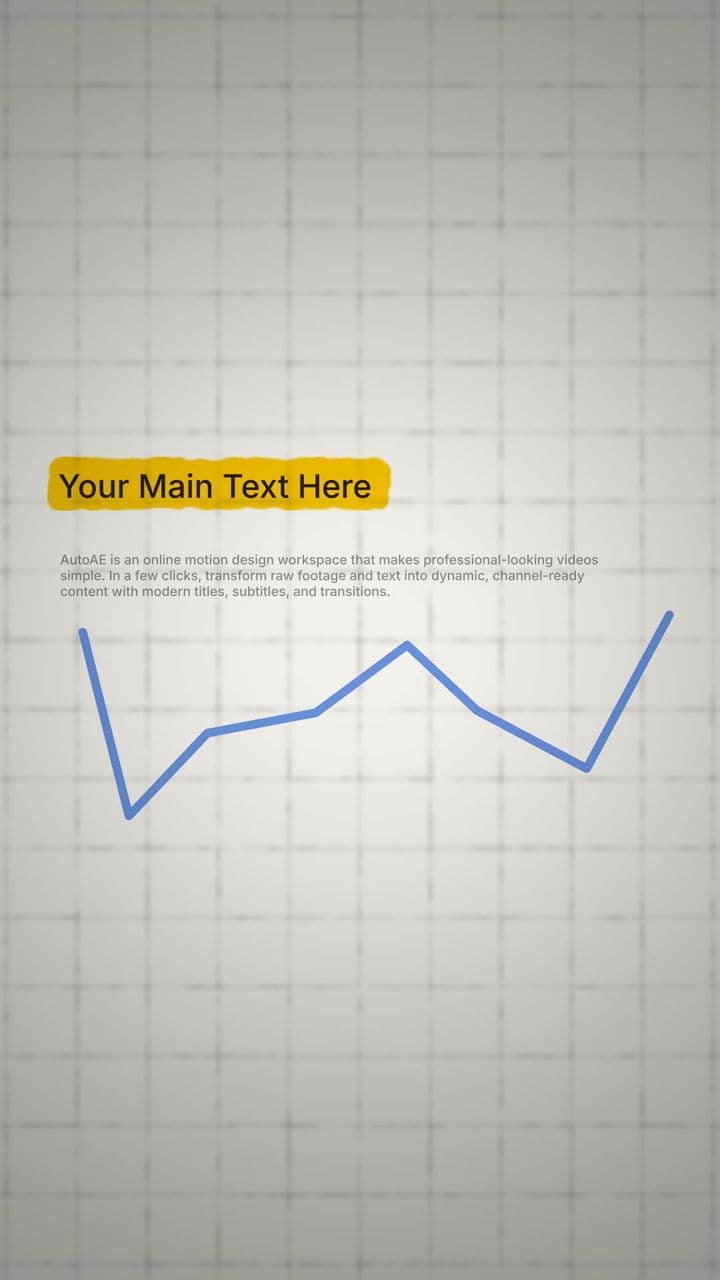
Dynamic Line Graph Animation with Highlight

2 Data Set Comparison | Monthly Trend Line Animation

Line Chart Animation with Highlighted Data Point | Trend Visualization

Chart Animation with Smooth Ascent

Animated Character with Green Data Growth Effect

Glowing Line Graph Animation for Upward Trend

5-Point Line Chart Animation with Subtle Bar Background
More Hooks By Moeinedits

5-Card Spread Animation | Vintage Tarot-Style Reveal for 3 Key Concepts

5-Card Spread Animation | Vintage Tarot-Style Reveal for 3 Key Concepts

Vintage Card Flip Animation | Single Text Reveal for Dramatic Highlight

Vintage Card Flip Animation | Single Text Reveal for Dramatic Highlight

10-Point Map Causal Relationship Animation

10-Point Map Causal Relationship Animation

4-Point Shuriken Reveal Animation

4-Point Shuriken Reveal Animation
More Animated Flowchart Templates

Clean Progress & Goal Tracking Infographic
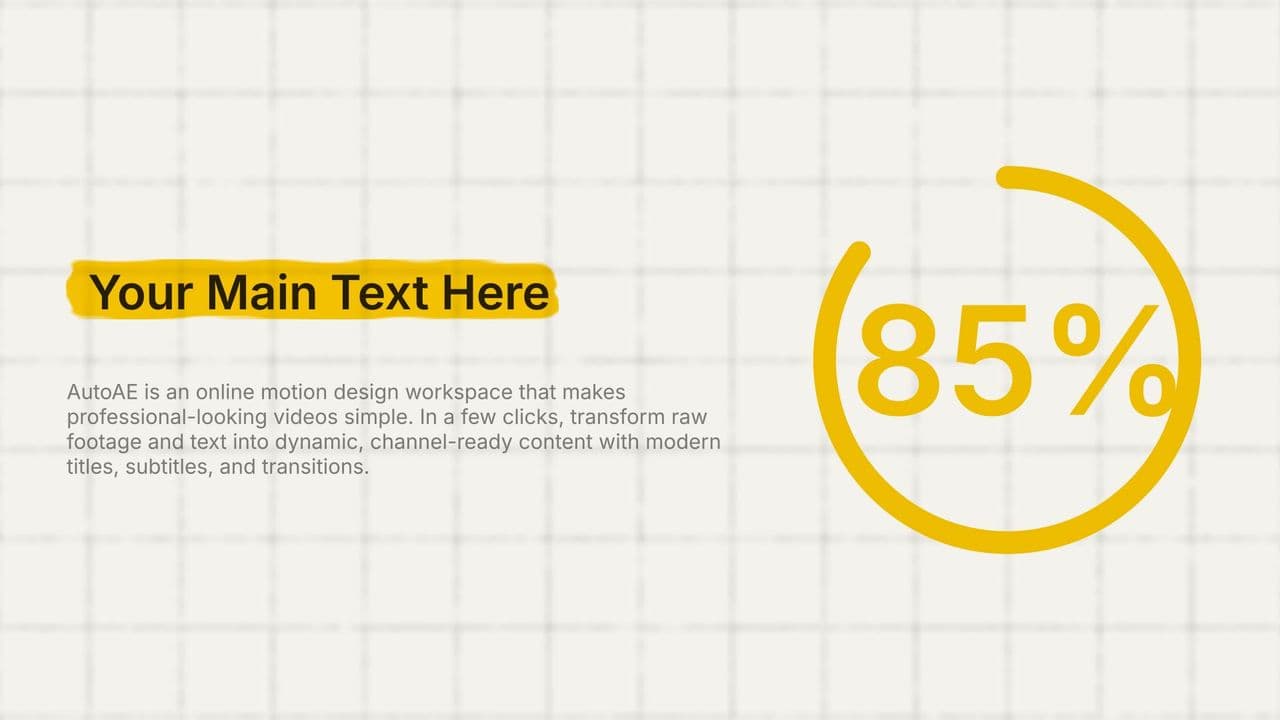
Clean Progress & Goal Tracking Infographic
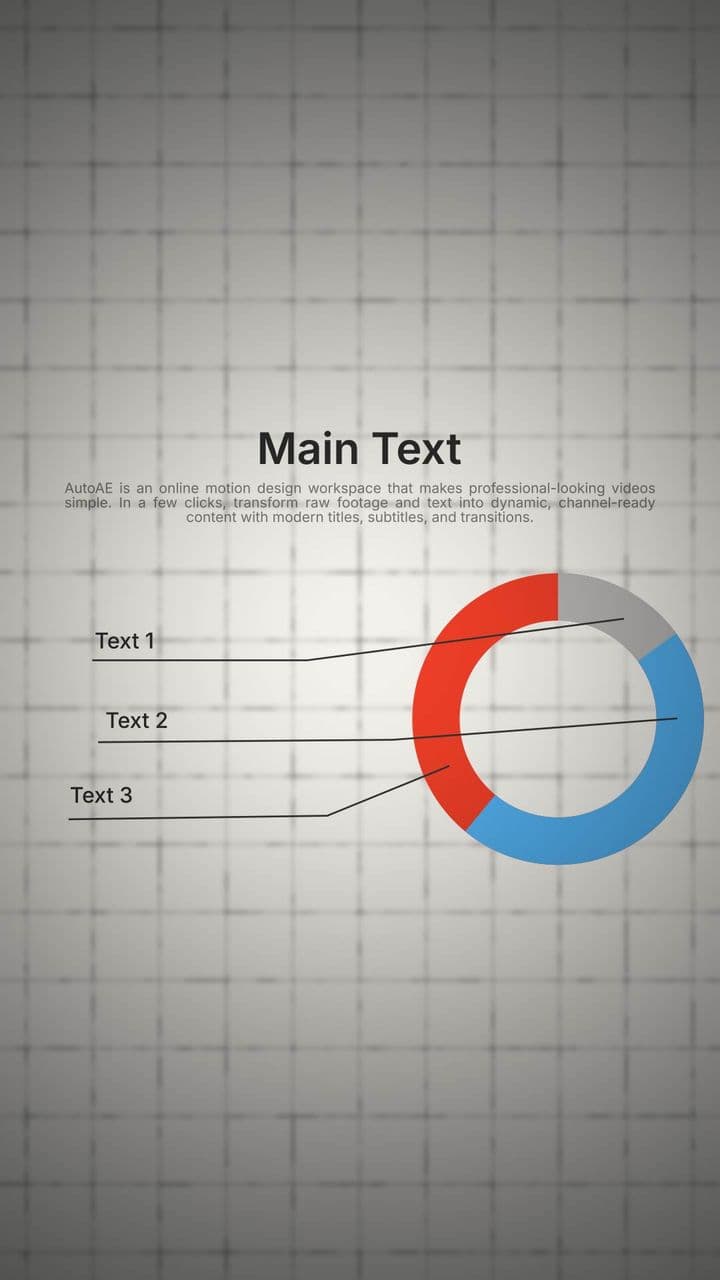
Dynamic 3-Point Donut Chart Animation
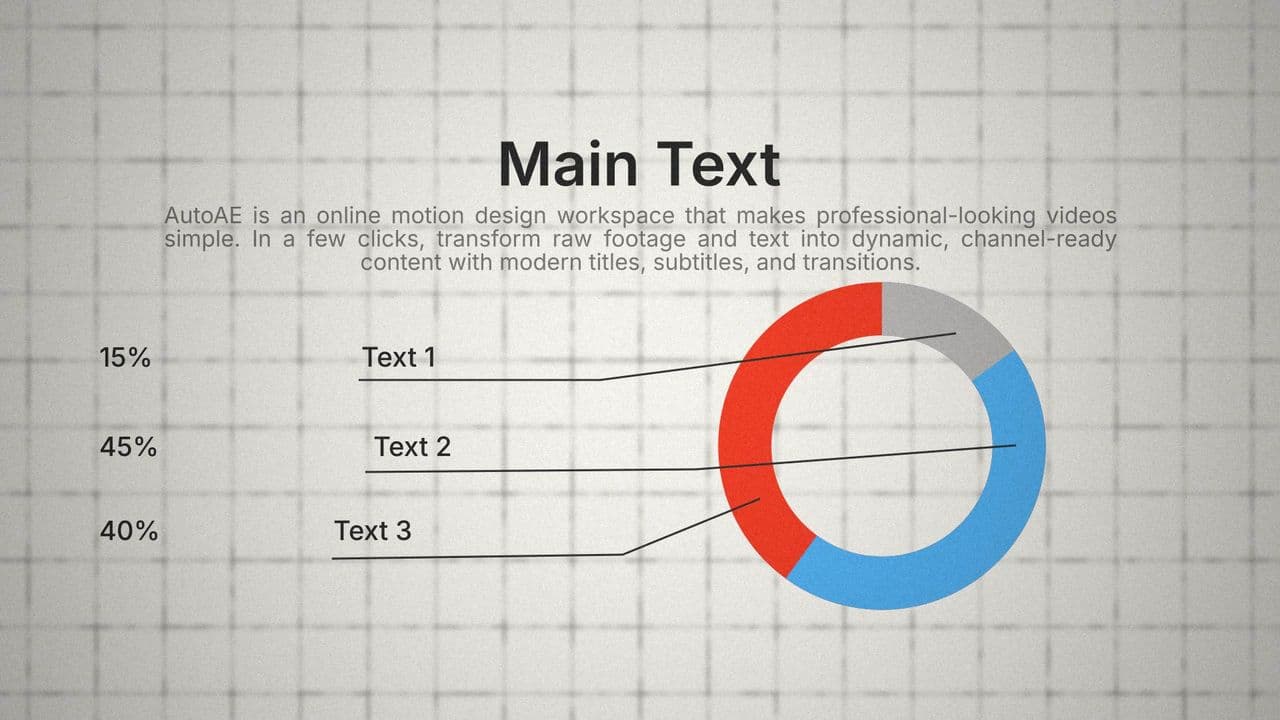
Dynamic 3-Point Donut Chart Animation
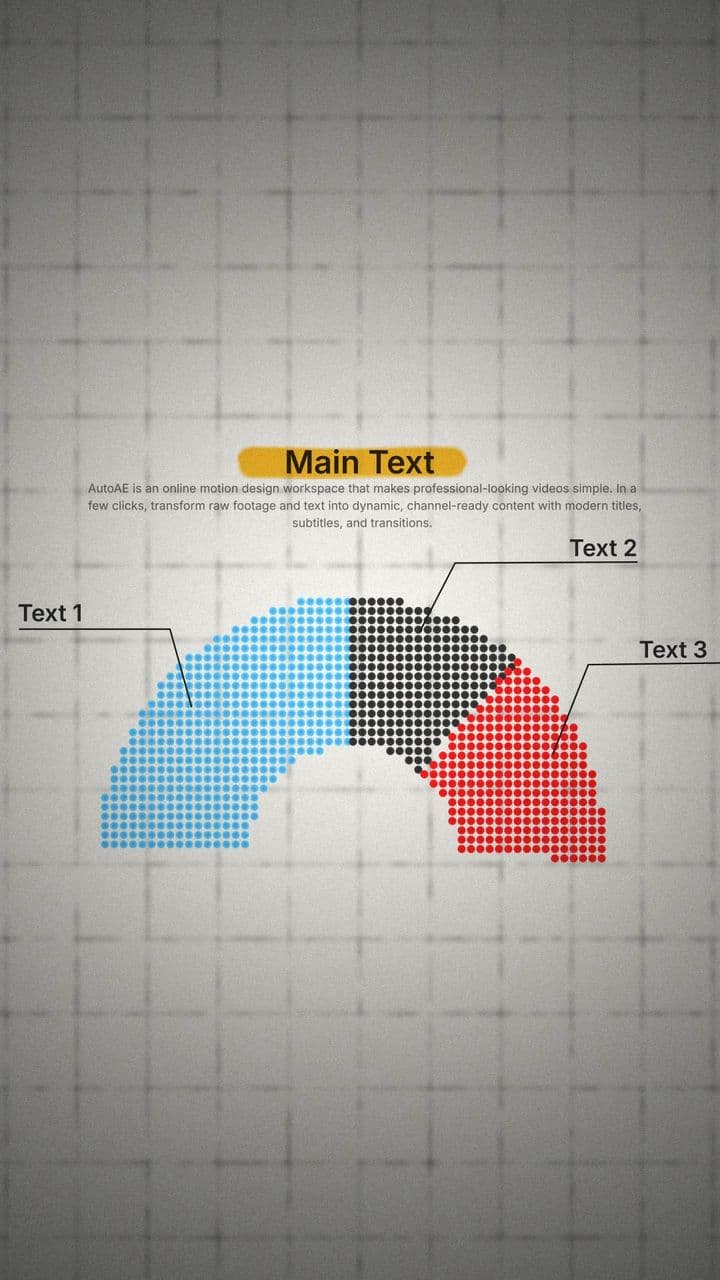
Dot Matrix Semi-Circle Animation (3 Segments) | Abstract Comparative Graphic

Dot Matrix Semi-Circle Animation (3 Segments) | Abstract Comparative Graphic

Animated Pie Chart Presentation (3 Data Segments)
