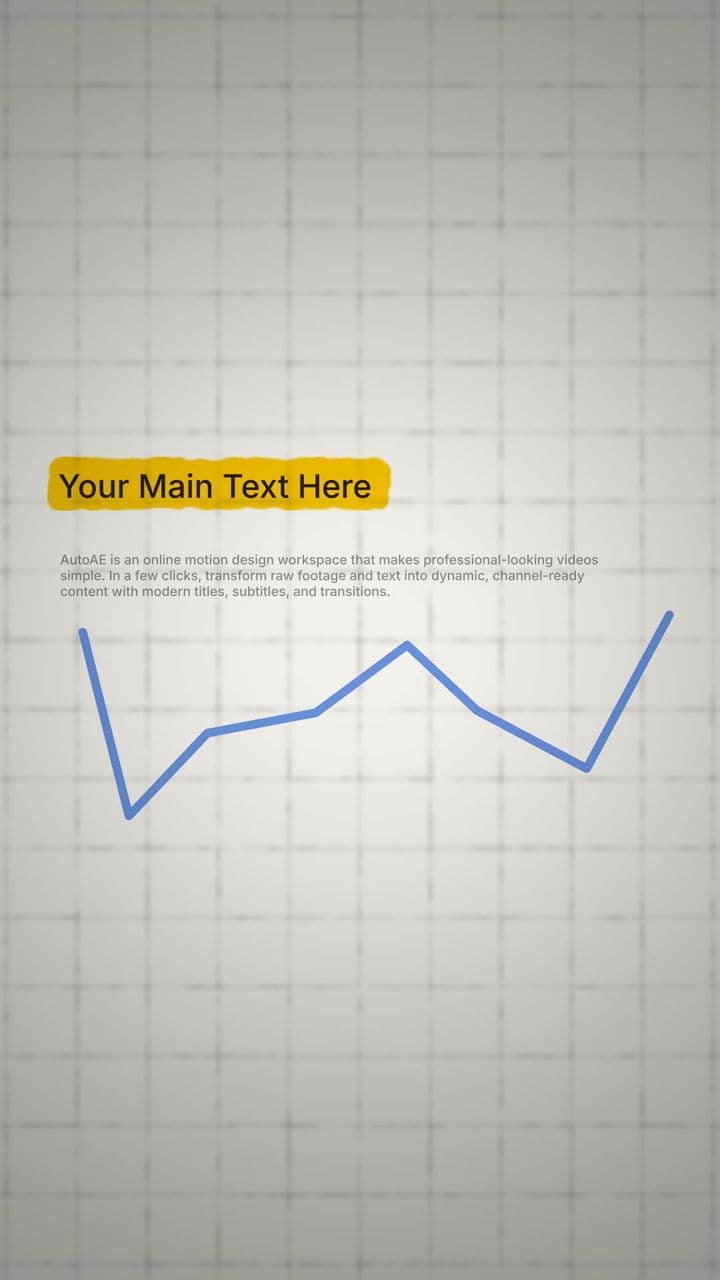
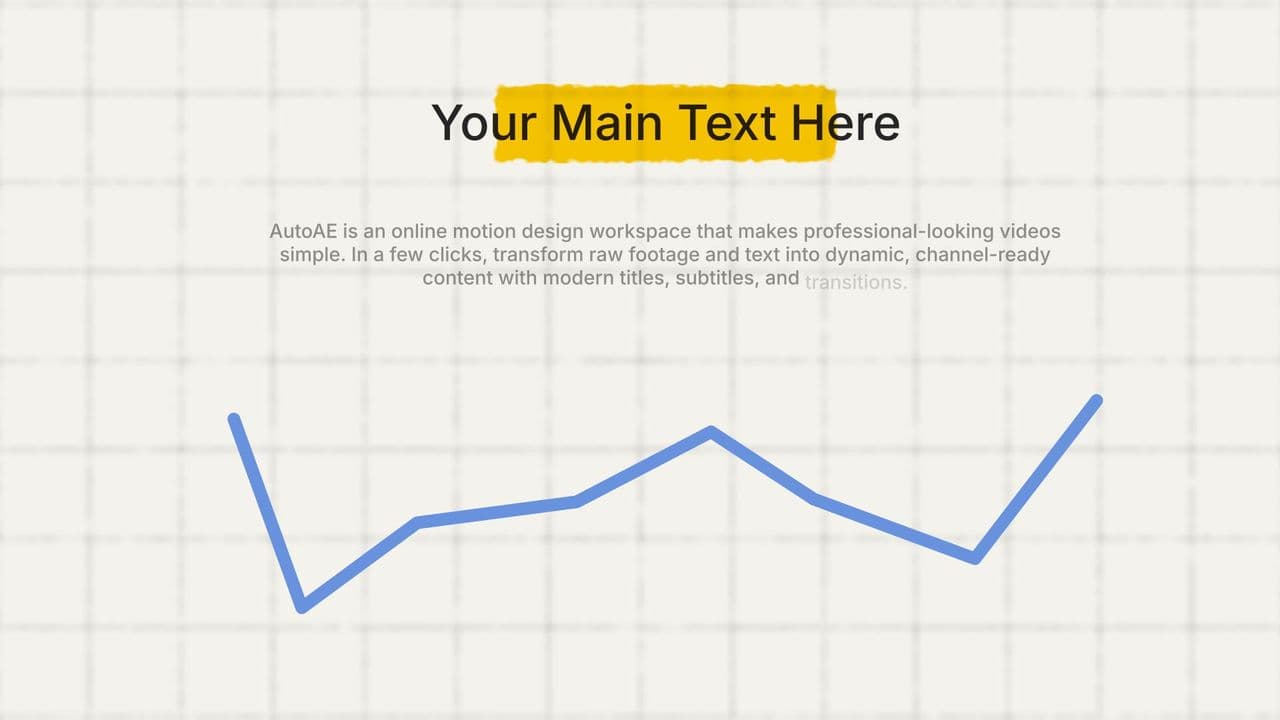
Line Chart Animation with Highlighted Data Point | Trend Visualization
ByDescription
This animated line chart highlights a key data point in a dynamic trend curve, drawing attention to growth moments, peak performance, or significant change. With smooth motion and a bold callout area, it’s perfect for visualizing success metrics, before-and-after comparisons, or storytelling through data. Ideal for creators sharing analytics, marketers visualizing impact, or educators illustrating key shifts. Use this animation to turn raw numbers into engaging visual narratives.
Details
9s
1920x1080
1 text
0 image
Similar Animations

5-Point Line Chart Animation with Subtle Bar Background

Chart Animation with Smooth Descent

Dynamic Line Graph Animation with Highlight

2-Line Trend Comparison Chart | Dual Data Animation with Soft Bars

Dynamic Line Graph Animation with Highlight

Glowing Line Graph Animation for Upward Trend

Chart Animation with Smooth Ascent

Chart Comparison Animation | Data Drop vs Growth Highlight
More Hooks By Moeinedits

5-Card Spread Animation | Vintage Tarot-Style Reveal for 3 Key Concepts

5-Card Spread Animation | Vintage Tarot-Style Reveal for 3 Key Concepts

Vintage Card Flip Animation | Single Text Reveal for Dramatic Highlight

Vintage Card Flip Animation | Single Text Reveal for Dramatic Highlight

10-Point Map Causal Relationship Animation

10-Point Map Causal Relationship Animation

4-Point Shuriken Reveal Animation

4-Point Shuriken Reveal Animation
More Animated Flowchart Templates

2 Media Vintage Evidence Timeline

2 Main Text Hand-painted Magnet Comparison

3 Slide Film Burn Process Steps

3D Sphere Character Animation: 3 Factors to Final Result

Interactive Icon Click Comparison & 4-Text Conclusion Animation

Podium Winners Animation: 3 Logo Ranking & Comparative Reveal

Clean Progress & Goal Tracking Infographic
